What’s new in Fraxion: KPI dashboard for procurement and spend management insights
We’re thrilled to announce the launch of a powerful new KPI dashboard in Fraxion’s spend analytics tool, Insights.
The dashboard empowers your company to track critical procurement and spend management metrics. Gain a comprehensive view of procurement efficiency, benchmark your performance against industry peers, and uncover actionable opportunities for improvement. With these insights, you can make informed decisions, streamline workflows, and achieve better outcomes—all from a single, intuitive platform.

Introducing the KPI dashboard
The new KPI dashboard offers a clear and detailed look at key performance indicators (KPIs) that impact spending and operational efficiency. From vendor utilization to approval times, these metrics empower your organization to make informed, data-driven decisions that drive process efficiency and cost-effectiveness.
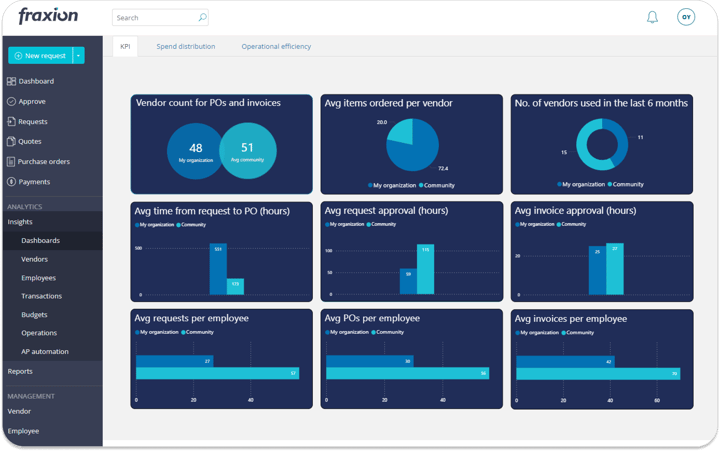
The KPI dashboard includes nine core KPI cards, each delivering valuable insights into different aspects of procurement performance. Let’s explore what each KPI card covers and how it can help you enhance your spend management strategy.
Key features of the KPI dashboard
1. Vendor count for purchase orders (POs) and invoices
This KPI card displays the total number of vendors used for purchase orders and/or invoices, compared to the average vendor count across other organizations using Fraxion. Tracking vendor count allows you to assess how effectively you’re managing your vendor base and whether there are opportunities to streamline or consolidate vendors.
2. Average items ordered per vendor
This card shows the average number of line items ordered per vendor, providing insight into purchasing patterns compared to industry standards. For instance, if your organization frequently places small orders, you might consider consolidating purchases to negotiate better rates or streamline delivery processes.
3. Number of vendors used in the last 6 months
This metric displays the number of vendors your organization has used for purchase orders and invoices over the last six months. Monitoring this can reveal how effective your vendor acquisition and selection processes are, as well as how efficiently you are distributing spend across your vendor base.
4. Average time from request to PO
This card measures the average time taken, in hours, from submitting a request to creating a purchase order. Comparing this metric with community averages highlights potential areas for speeding up procurement workflows and improving responsiveness to demand.
5. Average request approval time
This metric displays the average time, in hours, from the moment a request is submitted to the time it receives full approval. Tracking and optimizing this KPI can reduce bottlenecks, helping you meet organizational demand more efficiently.
6. Average invoice approval time
This KPI monitors the average time taken for invoice approvals, from submission to final approval. By reducing approval times, organizations can improve cash flow management and build stronger relationships with vendors.
7. Average requests per employee
This card displays the average number of requests submitted per employee, offering insight into procurement workload distribution and efficiency across teams.
8. Average POs per employee
This KPI measures the average number of purchase orders processed per employee, allowing you to assess employee productivity and evaluate how effectively procurement duties are being managed within your organization.
9. Average invoices per employee
Similar to request and PO metrics, this card displays the average number of invoices processed per employee. Understanding this metric helps you ensure optimal resource allocation and workload management within procurement and accounts payable teams.
Benefits of the KPI dashboard
The KPI dashboard provides a centralized view of your organization’s procurement performance, empowering you to:
-
Benchmark performance against industry standards: Compare your performance with averages from the broader Fraxion community to identify strengths and opportunities for improvement.
-
Enhance process efficiency: Gain insights into turnaround and approval times, identify problem areas, and leverage actionable insights to streamline workflows, distribute workloads, and reduce cycle times.
-
Improve spend control and resource allocation: Monitor spend metrics to ensure resources are used efficiently and to identify high-expenditure departments or employees.
-
Boost your purchasing strategy: Identify opportunities to consolidate your vendor base and negotiate better terms and volume discounts to reduce your operational spend.
Ready to see how the KPI dashboard can inform your organization’s procurement and spend management strategy? Contact us to arrange a demo and let us show you how you can unlock new efficiencies and savings with Fraxion.